Table of Contents
Interactive Jobs
If you want to test software that requires GUI, MPI/Parallel/Multiple threads using interactive jobs may be useful.
Note that if you need a GUI – you’ll need to ssh with -X.
Run the following to start an interactive job:
sinteractive --ntasks 1 --nodes 1 --time 00:30:00 --mem 2GB
Once resources are allocated, you’ll be placed in an alternative machine (for your interactive session). You will need to re-load your modules.
Jupyter notebooks + Slurm
In an interactive job session you can open a jupyter notebook with the following steps:
Source envs for you interactive session For example you may run the following:
source ~/.bash_profile
module load git/2.18.0 gcc/9.2.0 openmpi/4.0.2 python/3.8.5
source venv/bin/activate
Setup tunnel + jupyter instance on cluster
To do this run the following:
ipnport=$(shuf -i8000-9999 -n1)
ipnip=$(hostname -i)
echo "Run on local >>> ssh -N -L $ipnport:$ipnip:$ipnport avajpeyi@ozstar.swin.edu.au"
jupyter-notebook --no-browser --port=$ipnport --ip=$ipnip
Local connection to interactive job
- run the command echoed above
- open the link to the jupyer notebook (printed in the previous window)
Run
exitwhen doneOtherwise the job will keep running, hogging resources, until it times out.
For convenience, I have added the following to my OzStar .bash_profile
# Interactive Jupter notebooks
alias start_ijob="sinteractive --ntasks 2 --time 00:60:00 --mem 4GB"
start_jupyter () {
    ipnport=$(shuf -i8000-9999 -n1)
    ipnip=$(hostname -i)
    echo "Run on local >>>"
    echo "ssh -N -L $ipnport:$ipnip:$ipnport avajpeyi@ozstar.swin.edu.au"
    jupcmd=$(jupyter-notebook --no-browser --port=$ipnport --ip=$ipnip)
}
export -f start_jupyter
This allows me to start an interactive job with start_ijob and start the jupter notebook with start_jupyter.
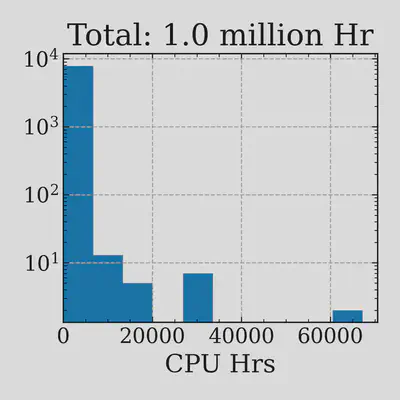
Plot CPU hours used for jobs
Academics should try to be cognizant of the energy impact of their jobs.
The following creates a file jobstats.txt that contains the CPU time (seconds) for each job run bw the start+end time specified.
sacct -S 2021-01-01 -E 2021-10-06 -u avajpeyi -X -o "jobname%-40,cputimeraw" --parsable2 > jobstats.txt
To plot the data you can use the following:

Downloading/Uploading data
Slurm job with data-download
The nodes with the fastest net speeds are the data-mover nodes.
The compute-nodes dont have internet connection, so any jobs that require data download sould be done as a pre-processing step on the data-mover nodes.
For example:
#!/bin/bash
#
#SBATCH --job-name={{jobname}}
#SBATCH --output={{log_dir}}/download_%A_%a.log
#SBATCH --ntasks=1
#SBATCH --time={{time}}
#SBATCH --mem={{mem}}
#SBATCH --cpus-per-task={{cpu_per_task}}
#SBATCH --partition=datamover
#SBATCH --array=0-5

module load {{module_loads}}
source {{python_env}}

ARRAY_ARGS=(0 1 2 3 4)

srun download_dataset ${ARRAY_ARGS[$SLURM_ARRAY_TASK_ID]}
Rsync data from/to OzStar
rsync -avPxH --no-g --chmod=Dg+s <LOCAL_PATH> avajpeyi@data-mover01.hpc.swin.edu.au:/fred/<OZ_PROJ>
Sequential jobs
Say you want to trigger sequential jobs (like a DAG), you will need to use the JobID for this and --dependnecy=afterany:<JOBID>. For example:
==> submit.sh <==
#!/bin/bash


ANALYSIS_FN=('slurm_analysis_0.sh' 'slurm_analysis_1.sh')
POST_FN='slurm_post.sh'
JOB_IDS=()

for index in ${!ANALYSIS_FN[*]}; do
  echo "Submitting ${ANALYSIS_FN[$index]}"
  JOB_ID=$(sbatch --parsable ${ANALYSIS_FN[$index]})
  JOB_IDS+=(JOB_ID)
done


IDS="${JOB_IDS[@]}"
IDFORMATTED=${IDS// /:}


echo "Submitting ${POST_FN}"
echo "sbatch --dependnecy=afterany:${IDFORMATTED} ${POST_FN}"

sbatch --dependency=afterany:$IDFORMATTED $POST_FN

squeue -u $USER -o '%.4u %.20j %.10A %.4C %.10E %R'
Click to view the submission scripts
==> slurm_analysis_0.sh <==
#!/bin/bash
#
#SBATCH --job-name=analysis_0
#SBATCH --output=out.log
#
#SBATCH --ntasks=1
#SBATCH --time=0:01:00
#SBATCH --mem=100MB
#SBATCH --cpus-per-task=1

module load git/2.18.0 gcc/9.2.0 openmpi/4.0.2 python/3.8.5
echo "analysis 0"
==> slurm_analysis_1.sh <==
#!/bin/bash
#
#SBATCH --job-name=analysis_1
#SBATCH --output=out.log
#
#SBATCH --ntasks=1
#SBATCH --time=0:01:00
#SBATCH --mem=100MB
#SBATCH --cpus-per-task=1

module load git/2.18.0 gcc/9.2.0 openmpi/4.0.2 python/3.8.5
echo "analysis 1"
==> slurm_post.sh <==
#!/bin/bash
#
#SBATCH --job-name=post
#SBATCH --output=out.log
#
#SBATCH --ntasks=1
#SBATCH --time=0:01:00
#SBATCH --mem=100MB
#SBATCH --cpus-per-task=1

module load git/2.18.0 gcc/9.2.0 openmpi/4.0.2 python/3.8.5
echo "post"