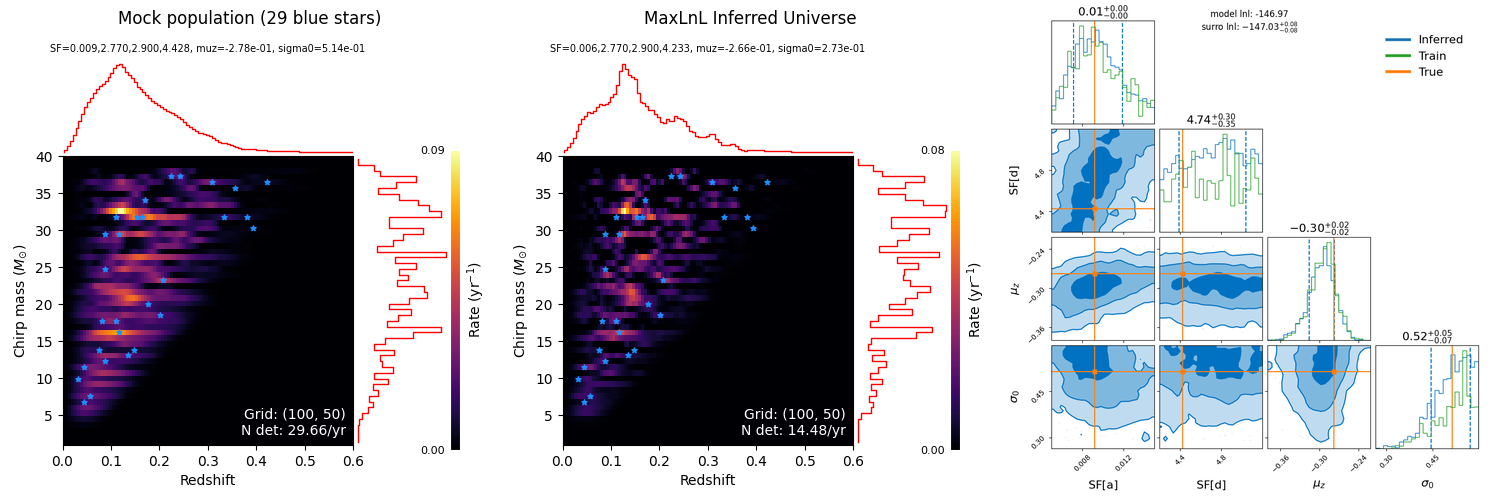
COMPAS ML LnL training and inference#
Walkthrough example of running analysis:
Load LnL data
Train GP model
Run inference
Plot results
import random
from compas_surrogate.inference_runner import run_inference


OUTDIR = "out_surr"
H5 = "det_matrix.h5"
random.seed(1)


def main():
    n_pts = [1000]
    for n in n_pts:
        outdir = f"{OUTDIR}/out_n_{n}"
        run_inference(
            outdir=outdir,
            n=n,
            cache_outdir=OUTDIR,
            det_matrix_h5=H5,
            universe_id=2500,
            clean=False,
        )


if __name__ == "__main__":
    main()
Plots of results#
GP Model metrics after training#
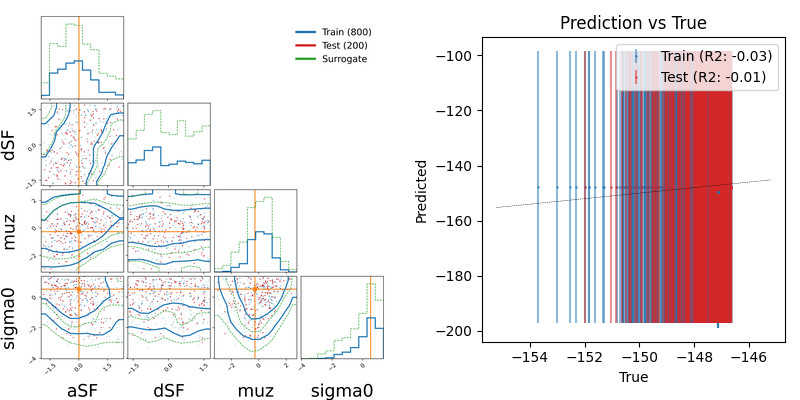
The LHS corner shows the distributions of:
training data (and distributions of the training samples weighted by the TRUE likelihood)
testing data
prior samples weighted by the SURROGATE likelihood
The RHS shows the true vs surrogate likelihoods and their uncertainties.
Warning
The surrrogate likelihood uncertainties andd values seem very strange! Is this a plotting error??
Sampling using the LnL-GP surrogate#
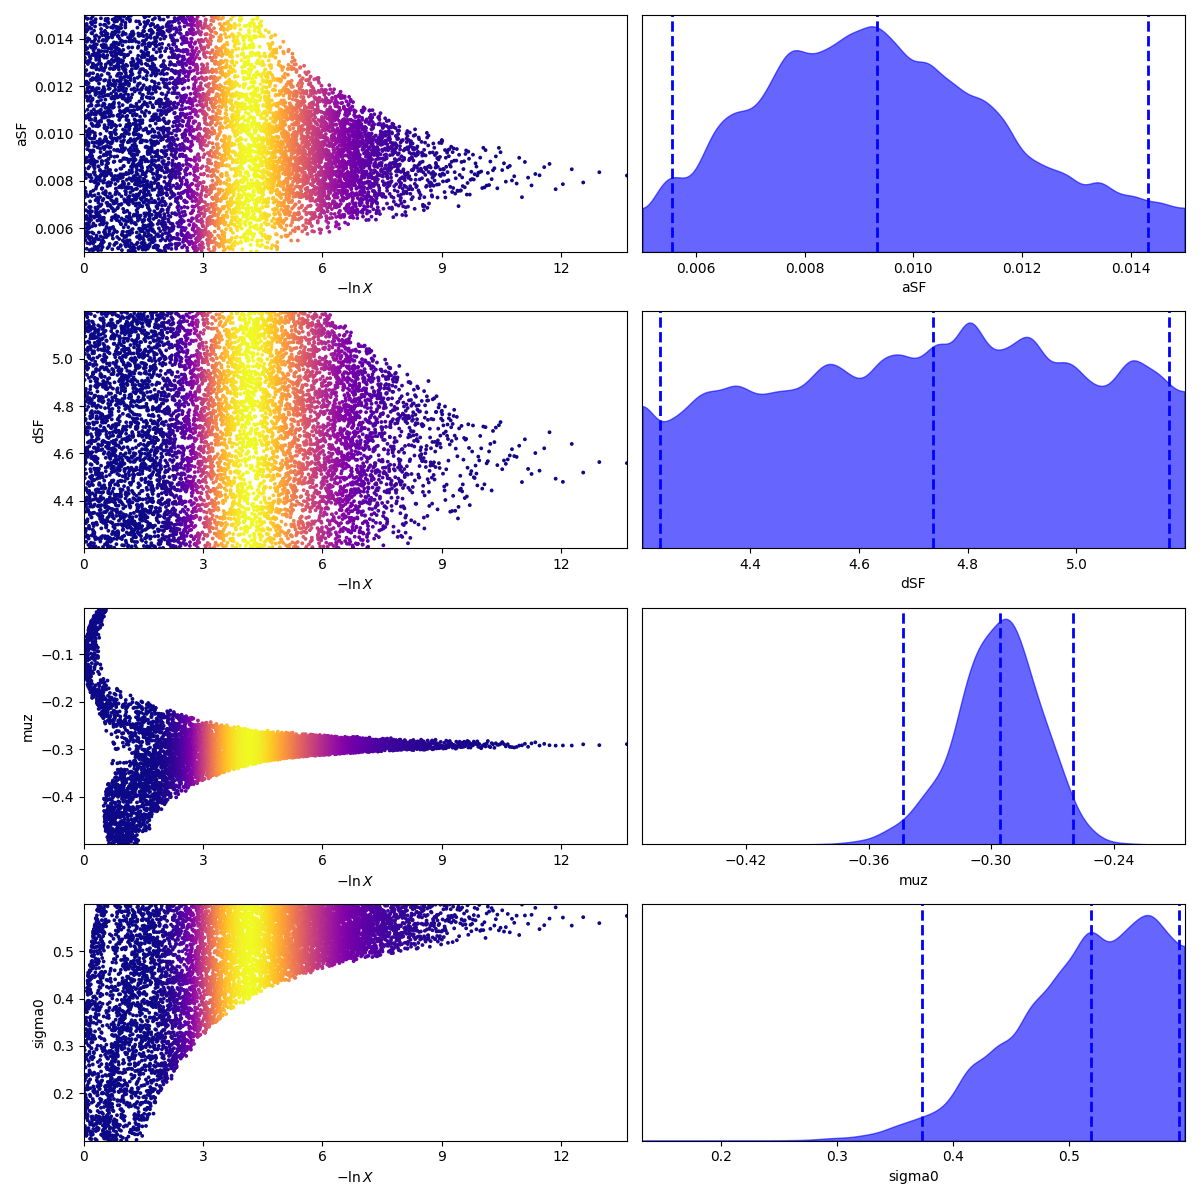
Inference results#
median |
maxlnl |
inj |
|
|---|---|---|---|
aSF |
0.01 |
0.01 |
0.01 |
dSF |
4.74^{+0.35}_{-0.3} |
4.52 |
4.43 |
muz |
-0.3^{+0.02}_{-0.02} |
-0.29 |
-0.28 |
sigma0 |
0.52^{+0.07}_{-0.05} |
0.57 |
0.51 |
lnl |
- |
-146.55 |
-146.97 |